Hey there appreneur. Liking the posts so far? Even if you’re not, you’re here…so, might as well get on with it, right?
Table of Content
In this post, I’ll be covering the holy grail, the Mecca, the Keystone or whatever else ‘precious’ or ‘crucial’ is to mobile app marketing – and that is Analytics.
Sure, you’ve heard this term being abused all over the internet on any remotely tech-related website. But what does this mean for mobile app marketing? As fate would have it, everything.
There are some technologies that simply exist to make other technologies perfect, and analytics is one of them. If your app was scouting customers in the bar, analytics is the perfect wingman.
Let’s look at the several ways in which Analytics can do that here.
By now, it must be clear that you can’t just throw your app into the marketplace and hope for the best. You need Analytics to:
And many more things, all of which lead you towards perfecting your app as much as possible including its design elements and functionality.
So, Analytics primarily helps in two things: App Marketing, and App Design.
Once your app is on the marketplace, there are certain things or indicators that you will begin to monitor – and analytics is the medium through which you can monitor them. These indicators help you understand user behaviour and reading them carefully will lead you to make data-driven decisions that aren’t intuitive.
So, what are the different kinds of things you can monitor when you’re looking at app performance?
Let me say one thing here – app usage is never uniform, and the way in which YOU think your app should be used MAY NOT be the way in which consumers use it at all. In fact, after integrating analytical platforms in your app, you’ll notice that there are several ways in which consumers use your app.
Another thing to note is that app analytics offerings by companies differ, depending on the kind of app you have – this might be a no-brainer, but I’m stating it anyway.
Third, app analytics may be a magical ingredient in the mix, but your app marketing strategy definitely needs to be analysed keeping competitors in mind.
Lastly, as concerns design and marketing both– choose the right application and the right key performance indicators (KPIs) is essential to get the right results.
Now let’s get to the informative parts.
Another term you often hear and encounter frequently is ‘metrics’. Metrics are simply measures, or indicators of particular things to do with the app. Keeping a track of these metrics is important when you’re trying to understand analytical trends – otherwise, it’s just jargon for appreneurs who’ve purchased potent software, but can’t make head or tail of what it’s telling them. Another word for them is KPI’s (Key Performance Indicators), which is just what they are – they measure app performance, keeping certain parameters in mind.
So here, we’ll discuss certain important metrics to keep track of before we come to what softwares you can use.
This is pretty straightforward. High numbers for both of these are favourable for your app, and this is probably one of the most used indicators. High downloads and low installations, on the other hand, may not be favourable – and low numbers on both means it’s time to boost your strategy. Another thing to remember is that this metric may indicate an app’s success, but this may not be financial.
This is different from the number of installations, as a single user may install the app on multiple devices and so on – so this too, needs to be kept in mind.
Now we come to the real deal – those guys who are using your app and most likely,
will not stop using it. You want to keep your eye on this number as it will come into many other calculations.
This is the amount of time a user spends on your app. Now, take into account that different apps have different measures of success here – gaming apps should ideally keep the user hooked for longer, and other apps like tech-based ones may just be lesser.
This is simple – giving you a ratio where you can tell how many users didn’t simply uninstall your app – in short, how many of them you’re keeping hooked.
Oh, LTV. This is such a biggie – you’ll find it splattered across forums and posts that tell you how to increase LTV – but what is it really? Simply put, it can you how much you need to spend to acquire a new customer – for life. I don’t need to tell you how important this is, right? It also tells you a lot about customer loyalty, and how you can predict growth. This also includes other metrics, like ARPU and Virality, which I’ll explain now.
This also has a somewhat complicated formula, so bear with me here as I try making it simple. LTV can be broken down in three components:
Monetization– How much customers add to to your mobile revenue (in the form of ad impressions, subscriptions, or in-app transactions – things we talked about in User Retention).
Retention – The level of engagement a customer has with your app, looking particularly at the length of the average customer lifecycle.

Virality – The sum value of additional users a customer will refer to your app. As in, how many more customers will existing customers hook in your favour?
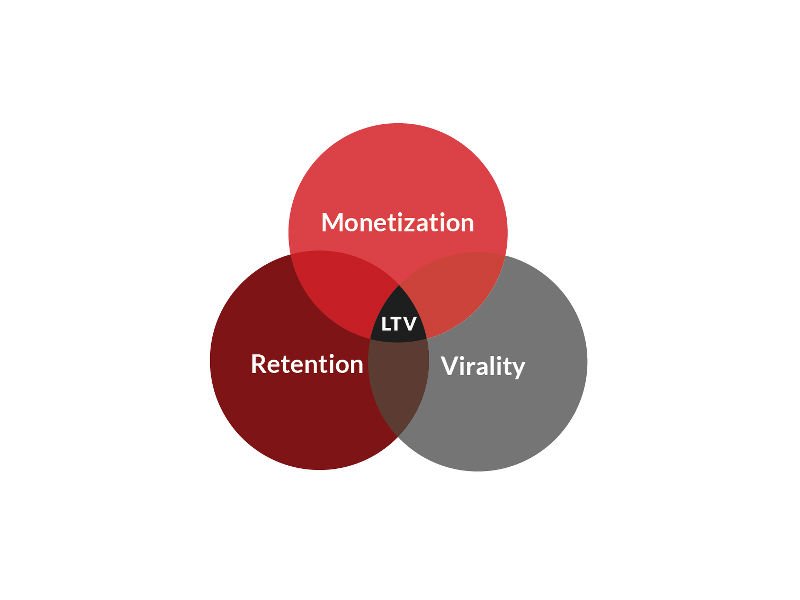
So the formula in this case is – LTV = f(Monetization, Retention, Virality)
The other complicated formula is =

Okay, try to breathe. No need to panic. This will also pass. So, let’s do this one step at a time.
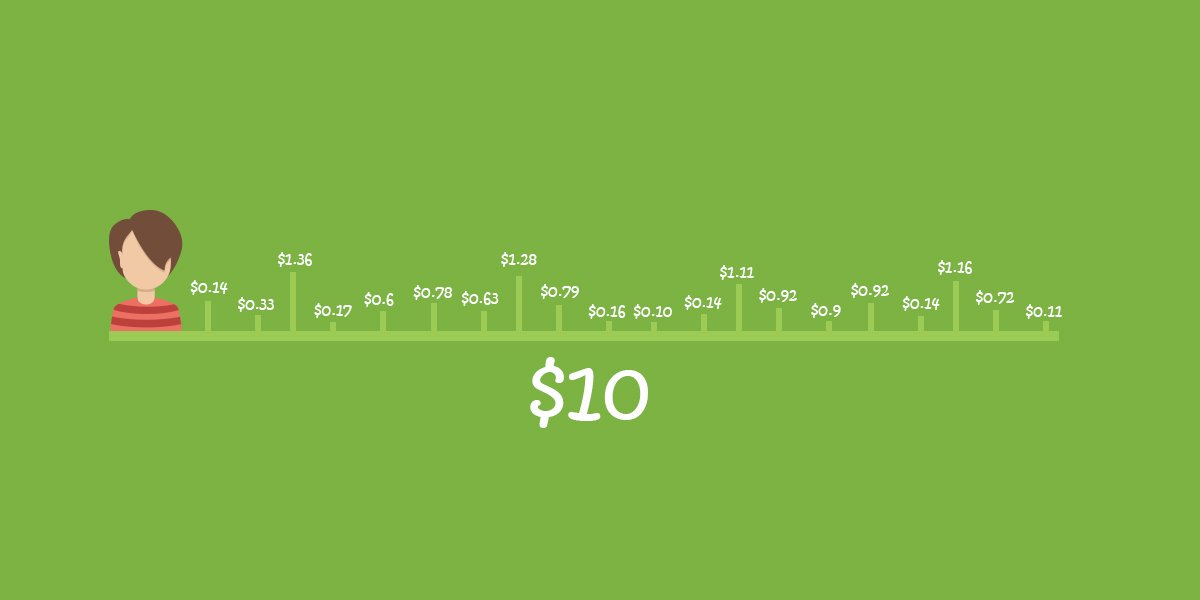
ARPU is average revenue per user, which you can get by simply dividingtotal revenue generated in a given time periodbyTotal number of active users in the same period.
Now to tackle churn. This is the number of customers lost in a set amount of time divided by the amount of users there were when the time began.
Now if you take the inverse of this result (divide by 1 – for you math dropouts) So if the time you’re considering is a month, and the churn rate is 50%, then the customer will last for two months on your app. Simple enough?
Alright. Referral value is a little hard to calculate, so leave it to you to research further if you’re that interested. Otherwise, we can set it to zero.
Ultimately, when you plug everything in the formula, you’ll get a sum of money. Say it is $3. If the cost of acquiring a new customer is $2, then you’re good to go – basically, as long as the average customer lifetime value (LTV) exceeds the cost of customer acquisition (CAC), you are on the right track.
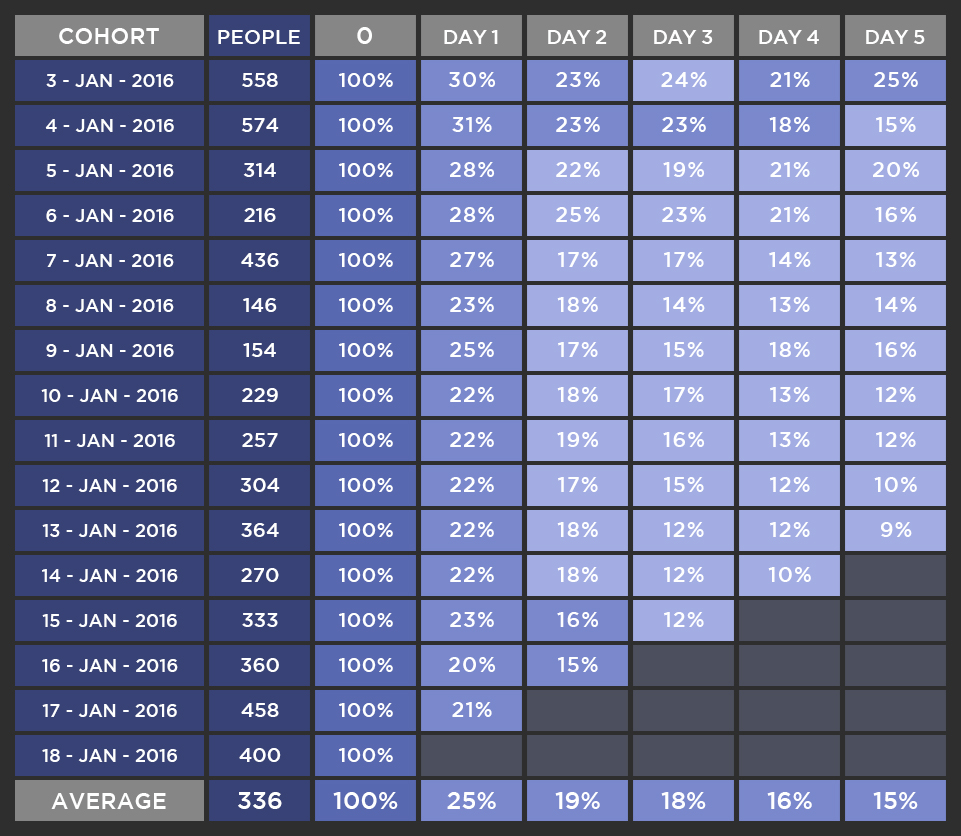
We briefly touched upon this in the post on User Retention. A cohort means a group – and you create cohorts of users by using certain measures. Like, you can group them based on User Lifespan (say 1-2 months is one cohort, and so on) and you can use these groups to your advantage by targeting them appropriately, like taking measures to retain those who leave too quickly.
This is also very useful for seeing the effects of changes you make in the app – be it new features, monetization or a new update.

You’ve seen this screen pop-up every time as a consumer on your phone, but how trustworthy is your app really? The amount of access users give your app determines your brand image and its trustworthiness – also, a lot of user retention happens only because consumers grant your app access to push notifications, or connect it to their contact list and so on. So, keeping an eye on this metric is totally worth it.

This has some highly technical information if one were to break down what all factors into why your app is crashing, but to sum it up, tracking your app’s crashes is necessary for you to take adequate measures for better service and retention.
Well, I’m keeping it to this level for now to not muddle you any further. Now, let’s take a look at a few softwares that do the job of tracking these metrics.
I’m only going to include a few ones that I think are particularly potent, and by themselves, unique – otherwise, most companies make pretty much the same offerings. Ultimately, it’s how you use your analytics that matters – but the tech obviously makes a difference. Mediocrity doesn’t help anywhere.
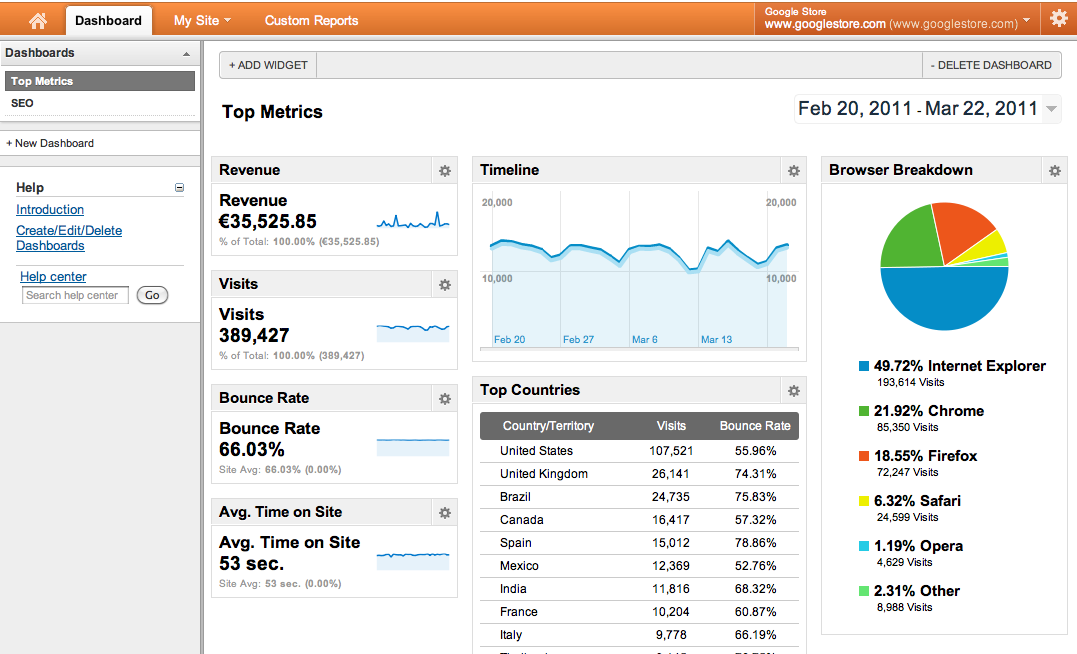
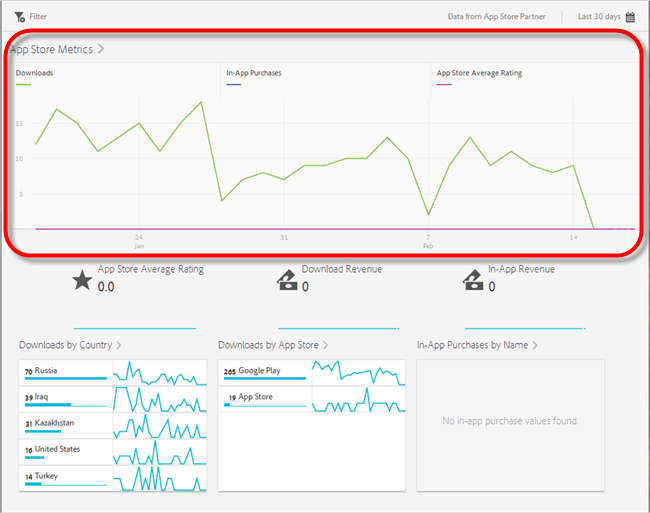
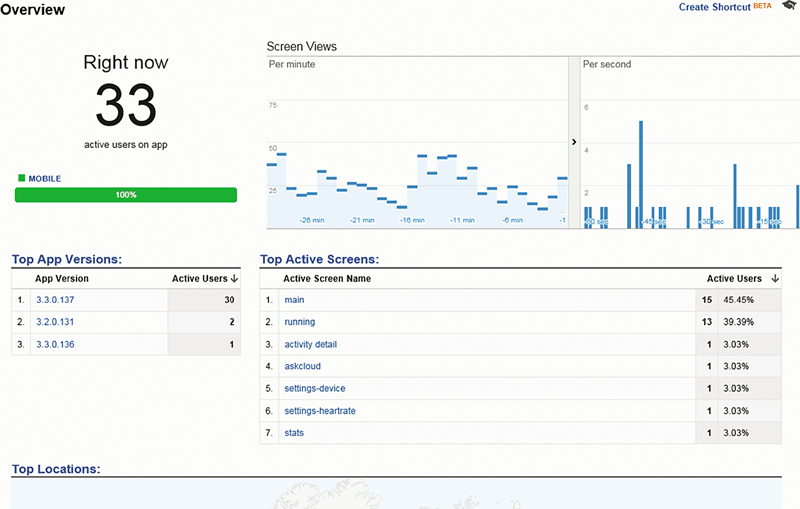
Google analytics is the jack-of-all-trades kind of platform, and it is free to boot – thus rightly earning a mention on my list. It can track your app analytics, and present them in a comprehensive overview.
The indicators it uses to measure app analytics are Acquisition (for new users), Mobile App Audience (demographic breakdown of users, new versus returning users, the version of the app getting downloaded and so on), Mobile App Behaviour (app testing, smooth functionality, speed tests and crashes) and lastly, the conversion rate (see how many people visited the site and then how many actually downloaded your app).
You can also check the mobile device brands used, service provider, mobile input selector, operating systems and screen resolutions on which your mobile site is accessed.
Pretty handy, right?
Google Analytics also has extensions that act like icing on the cake, like AdMob, which adds to the whole user acquisition data for Android apps. You can also see the referral source that is driving users to the app page and also measure the number of drop offs and stuff, which is good for having an extra edge.
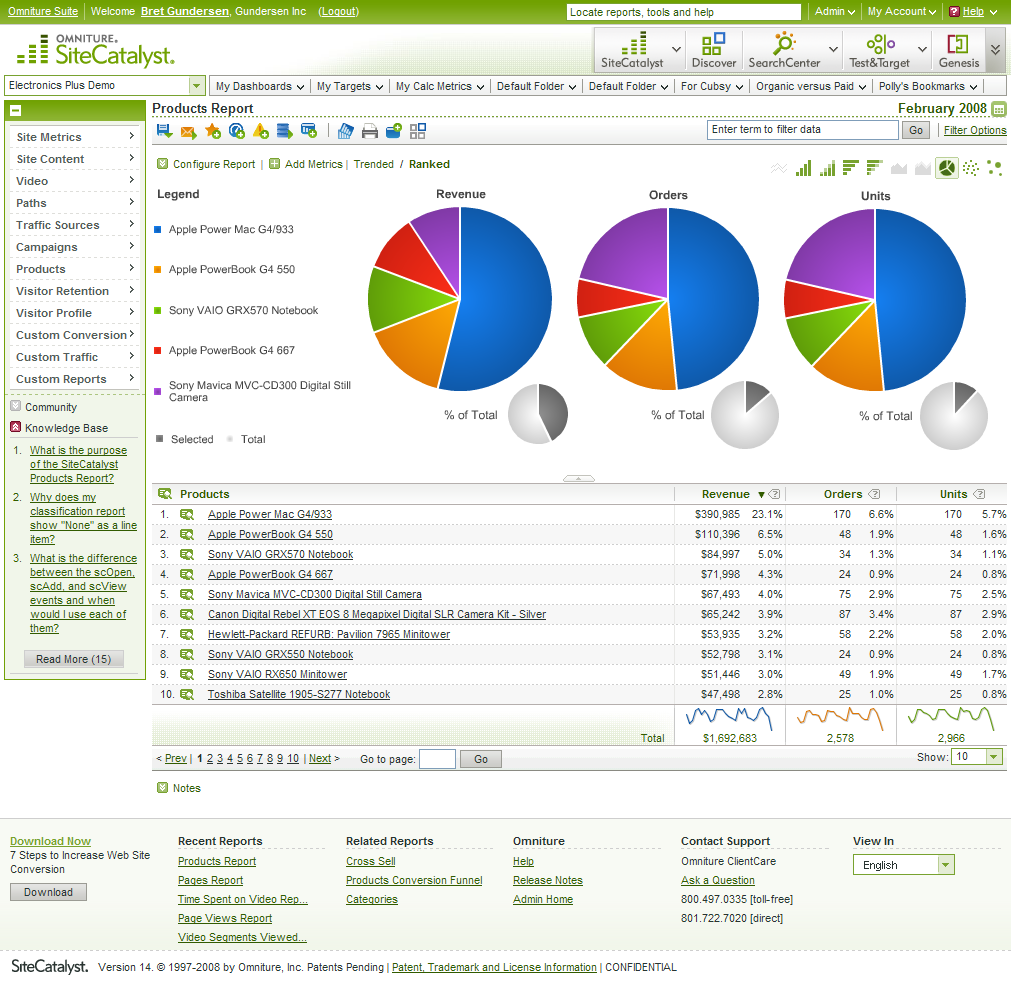
Another highly powerful platform for your analytics needs, Omniture was acquired by Adobe Systems in 2009. Adobe is familiar, yes? Just kidding. Anyway, Omniture will either just blow you away or confuse you with the sheer amount of features it has. I mean, it’s got different categories under which features are listed, so it’s quite exhaustive.
Be it Web Analytics with SiteCatalyst Feature, Data Mining with its Discover Feature or Multi-Variate Analysis with its Test and Target Feature, Omniture has it all. It even gives you product and content recommendations, and Merchandising pathways, so there’s no reason to not choose it. Only, it’s not as straightforward as Google Analytics is – not for everyone anyway.
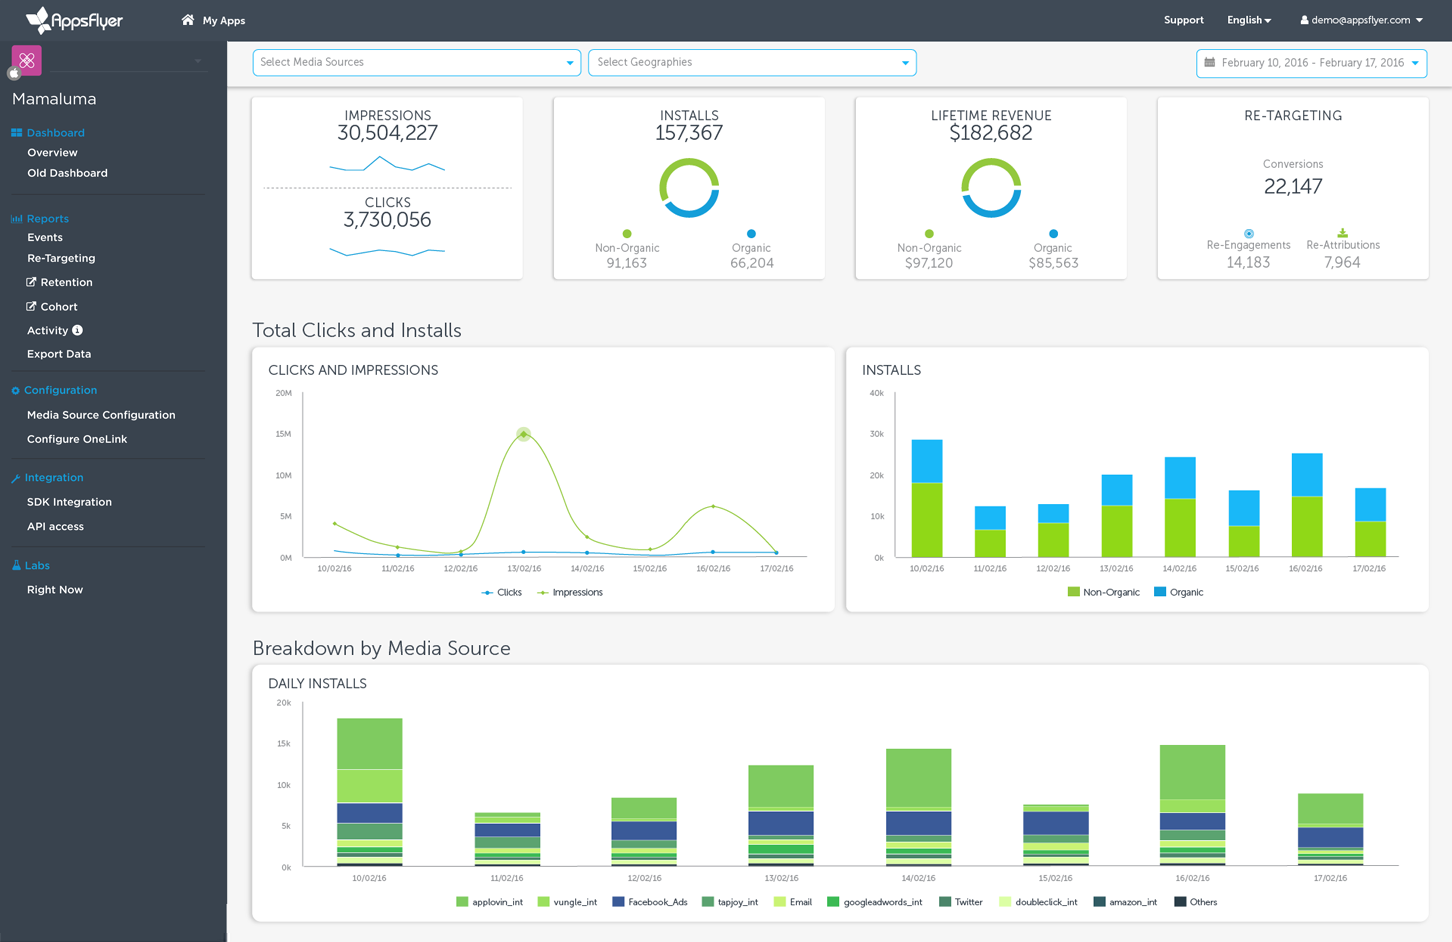
The dark horse for most mobile app marketing concerns, AppsFlyer is great for several reasons. Firstly, it is a mobile apps marketing platform which allows app developers, brands and ad agencies to track and optimize their user’s acquisition – the first thing we spoke of in the series.
AppsFlyer is has also integrated with dozens of partners, which becomes a good platform for advertisers to promote and measure their mobile app promotional campaigns. As this is also exclusively for mobile apps, all this power is condensed at your fingertips, which may be a very heady feeling.
AppsFlyer is also quite dynamic, as it gives you 24/7 access to mobile attribution, the capability to retarget high-value users with the relevant ads at the right time and even outlines a daily user acquisition campaign analysis so you can adapt your strategy on the fly. This is one high-powered wingman for sure, and you don’t want to give this a miss at any cost.
There are several others that I’d like to mention for your reference, which you can then look up at your leisure.
Remember, we mentioned that analytics not only works for marketing purposes, but can also help with testing features on your app? This includes streamlining the UI/UX experience, which is the key to understanding what features you need in your app, and what isn’t really working.
Here, I’ll give you a list of a few tools that help you streamline design with the help of their integrated features. Some tools work for both, iOS and Android, while some are exclusive. Different tools also may measure different aspects of the UI/UX – from examining how many users were stuck on what screen of the app, to the amount of touch-based inputs on certain sections of the app. We’ll clarify things as they come along.
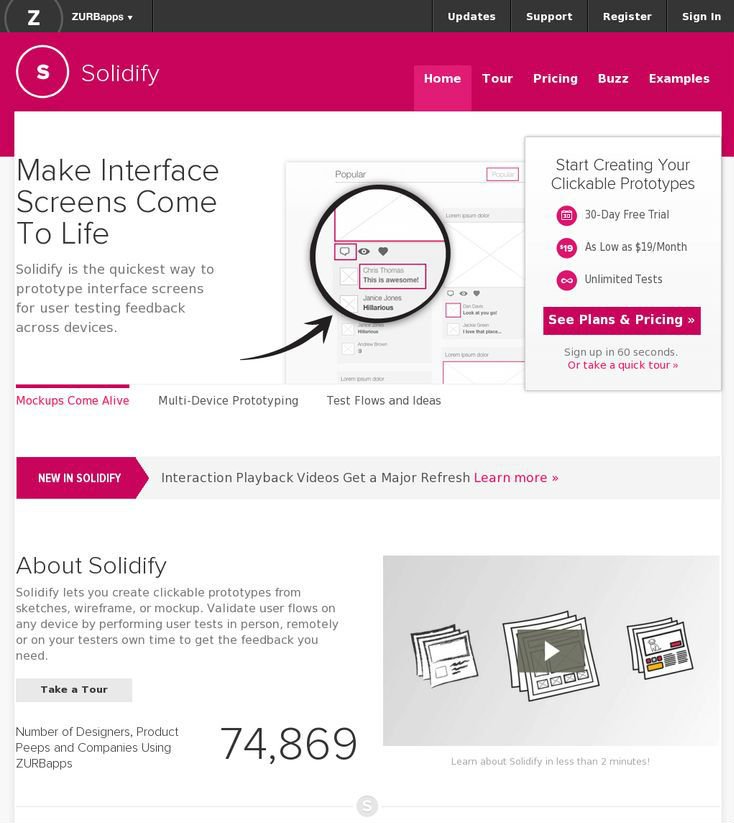
This is an absolutely awesome, lightweight tool, which doesn’t even require you to have your audience in the same room – you can send an email link of your testing session to people and they can do everything on their machines! You can create the session, add pictures, throw it in mobile chrome, pick your audience, and you’re good to go.
Naturally, it can also work on any device since it’s so mobile. You can give your audience tasks to complete and ask for feedback. It records their screen gestures (yes, this is a thing called Touch-Heatmaps) along the way, and automatically tracks stats. This is a great tool for testing prototype versions of mobile concepts with people all over – so you’re not restricted.
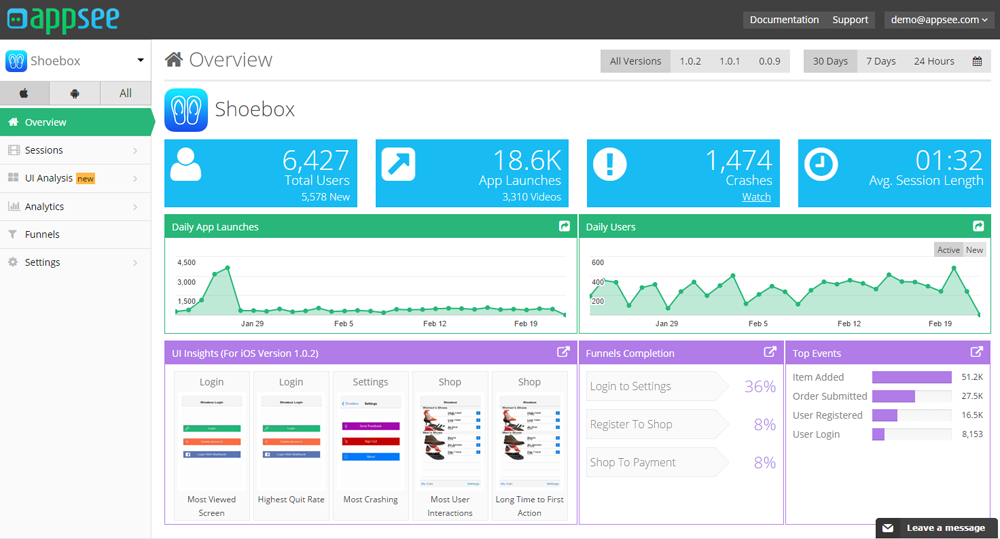
With this tool, you have the power to see exactly what users are doing on your app. With session recordings, touch heatmaps, and analytics, it’s pretty much like mind-reading. This can quickly reveal usability problems with the app.
With this, you have access to a paid panel of testers and you need to specify what they have to do. Seeing what a user does with the app is an entirely different experience because each person can use it differently, even in ways you wouldn’t think of.
AppSee can measure all these funky things:
User Recordings: The User Recordings feature captures every screen, tap, swipe, and action in a session. You can decide how many user interactions you want to record and segment by demographic and even specific screens.
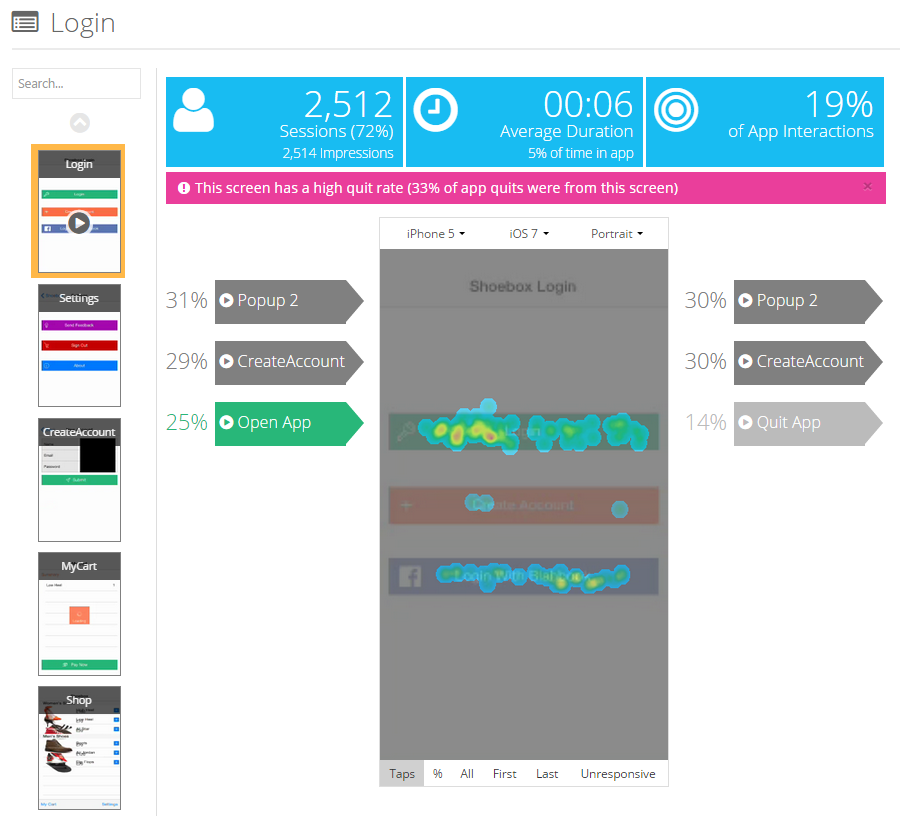
Touch Heatmaps: All touch gestures – swipe, tap, and pinch – are aggregated into one whole thing called the touch heatmap . They help you find out which parts of the screen users spend most of their time on. Knowing that, you can place your clickable buttons in the most optimal manner – we touched upon this briefly in the Retention section.
Real-time In-app Analytics: In-app analytics show you how users interact with an app’s screens. This feature can help you discover which screens have a higher quit rate, which screens are causing confusion, and the top actions by users.
In addition, Appsee can send you crash reports and reports on unresponsive gestures.
This also works on all platforms, so it’s a pretty sweet tool.
This one provides flexible A/B testing for mobile apps. A/B Testing basically refers to you comparing two versions of a web page (Page A or Page B) to see which one performs better. The best thing about this one is that there is no coding whatsoever required to use it.
Leanplum also offers powerful segmentation, and users can be segmented based on demographics, behavior, and device type. You can set custom parameters to segment users. Lastly, it comes with all the good stuff like cohort analysis, comparison graphs, stack graphs, etc.
Other tools to check out here are:
Analytics is quite the creepy wingman, as you may have figured out by now. The reason that it succeeds is because it’s watching everything, from the internals of your app, to the marketing outlets and its performance on the app store itself. Using Analytics is absolutely necessary for Mobile App marketing, as much as it is for finding the right combination of elements for your app itself. It is necessary for user retention in terms of feedback gathering etc. via cohort analysis – as has been mentioned in our User Retention post, as well as monitoring Touch-based heat-maps to understand which sections of your App Overlay have been used the most.
So there you have it – your somewhat comprehensive guide to finding the right wingman for your app. Due to the technical nature of this topic, I’ve tried keeping it as light as possible, but do not hesitate to take the professional’s help when it comes to developing actionable strategies based on crunching all the data that Analytics will provide you – you won’t become an Analytics expert overnight anyway.
Trust me, because despite having spent so much time with it myself, I’m still learning. I hope you are too!
Till next time, and good luck finding your wingman!


 Contact Us
Team Up With Us Today For An Unforgettable Service Experience


 Book Free Consultation